Let’s look at a real example: a short CPU spike that can appear blurred on your dashboard if your query resolution isn’t set properly.
The Scenario
- Panel range: 12:00–01:00 (1h)
- Scrape interval: 15s
- Metric:
cpu_percent(gauge) - Event: CPU spikes to 90% for 20 seconds at 12:05:15 → 12:05:35
Prometheus scrapes every 15s, so the raw samples are:
| Time | CPU% |
|---|---|
| 12:05:00 | 10 |
| 12:05:15 | 90 |
| 12:05:30 | 10 |
The data is there but what how accurate your graph is depends on your query.
Baseline Query (Blurred)
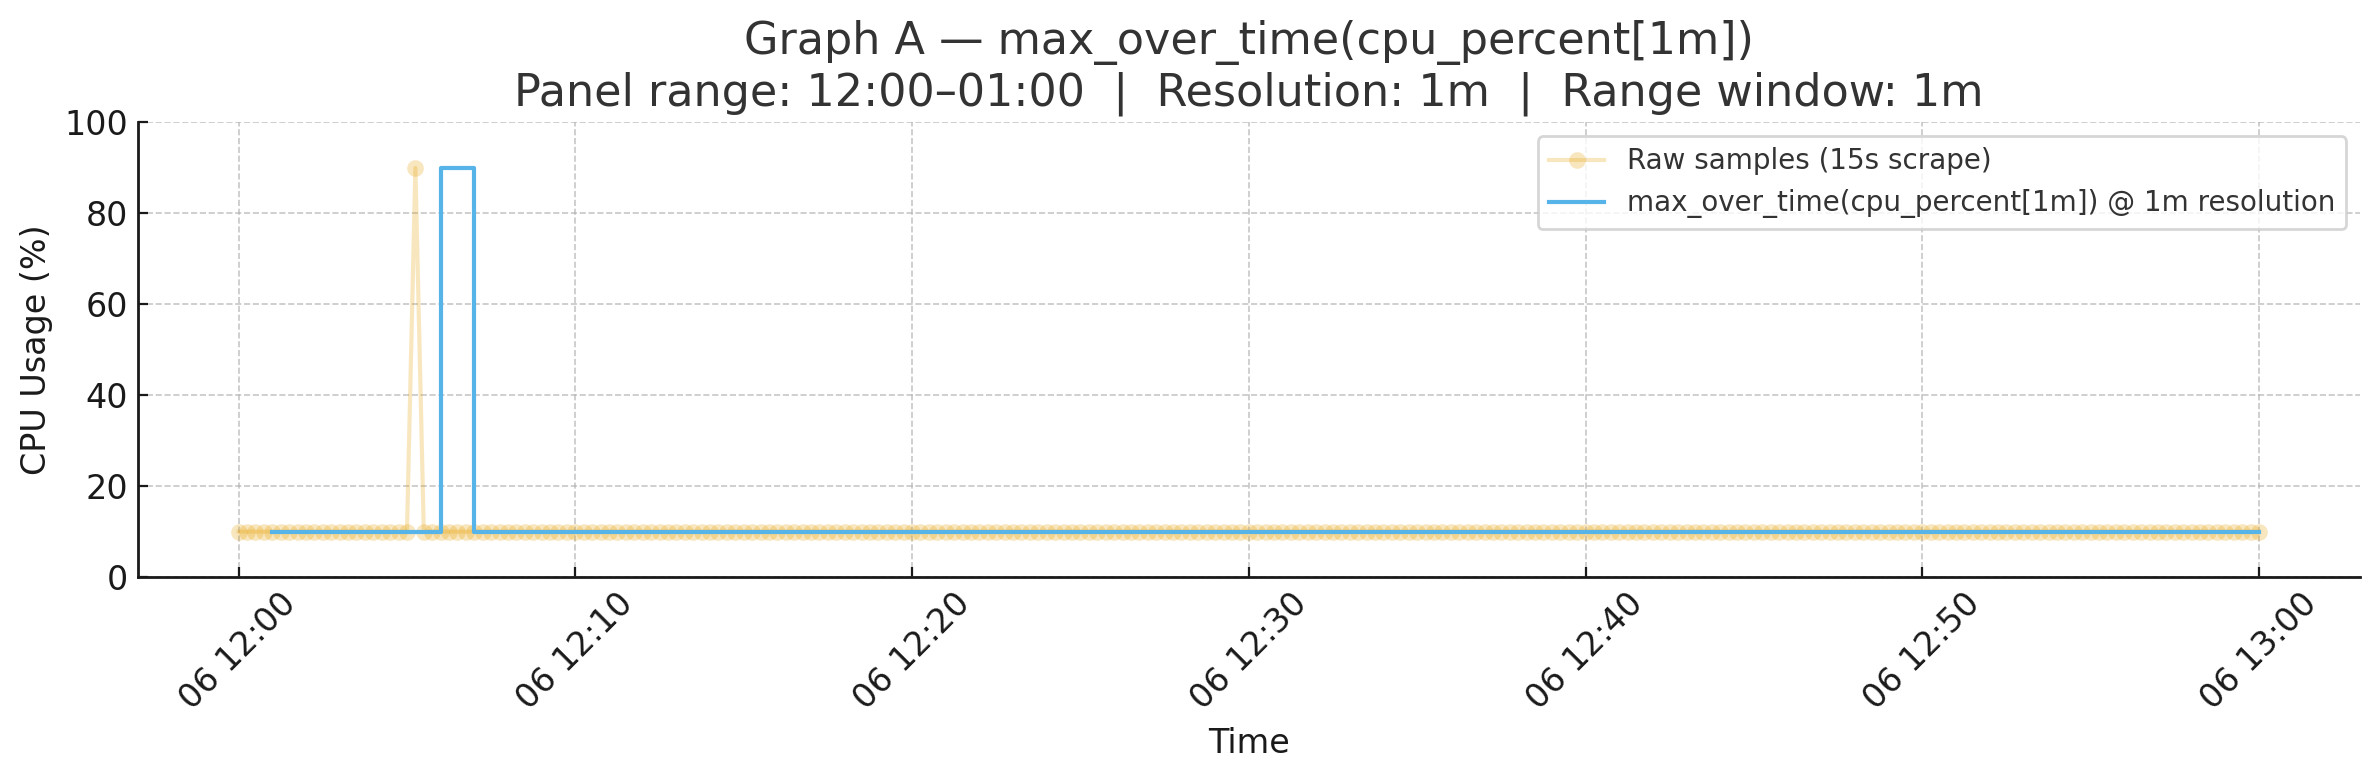
max_over_time(cpu_percent[1m])
On a 1h panel, Grafana (or other vendor equivalent) dashboards defaults to ~1m resolution. Prometheus only evaluates the query at 12:05, 12:06, 12:07, …
- At 12:05 → window [12:04–12:05] → max = 10
- At 12:06 → window [12:05–12:06] → includes spike → max = 90
- At 12:07 → window [12:06–12:07] → spike gone → max = 10
The spike appears, but it’s blurred into the “12:05–12:06” bucket.
Timeline:
Raw samples (15s):
12:05:00 ─ 10%
12:05:15 ─ 90%   <--- spike
12:05:30 ─ 10%

Eval points (1m):
12:05 ─ 10%
12:06 ─ 90%   <--- spike blurred into 1 minute bucket
12:07 ─ 10%
Graph A — Baseline (max_over_time(cpu_percent[1m])):
Why it blurs
This is like checking your watch once a minute. If something happens at second 15, you’ll only know it happened somewhere in that minute.
Subquery with $__range:15s (Sharp)
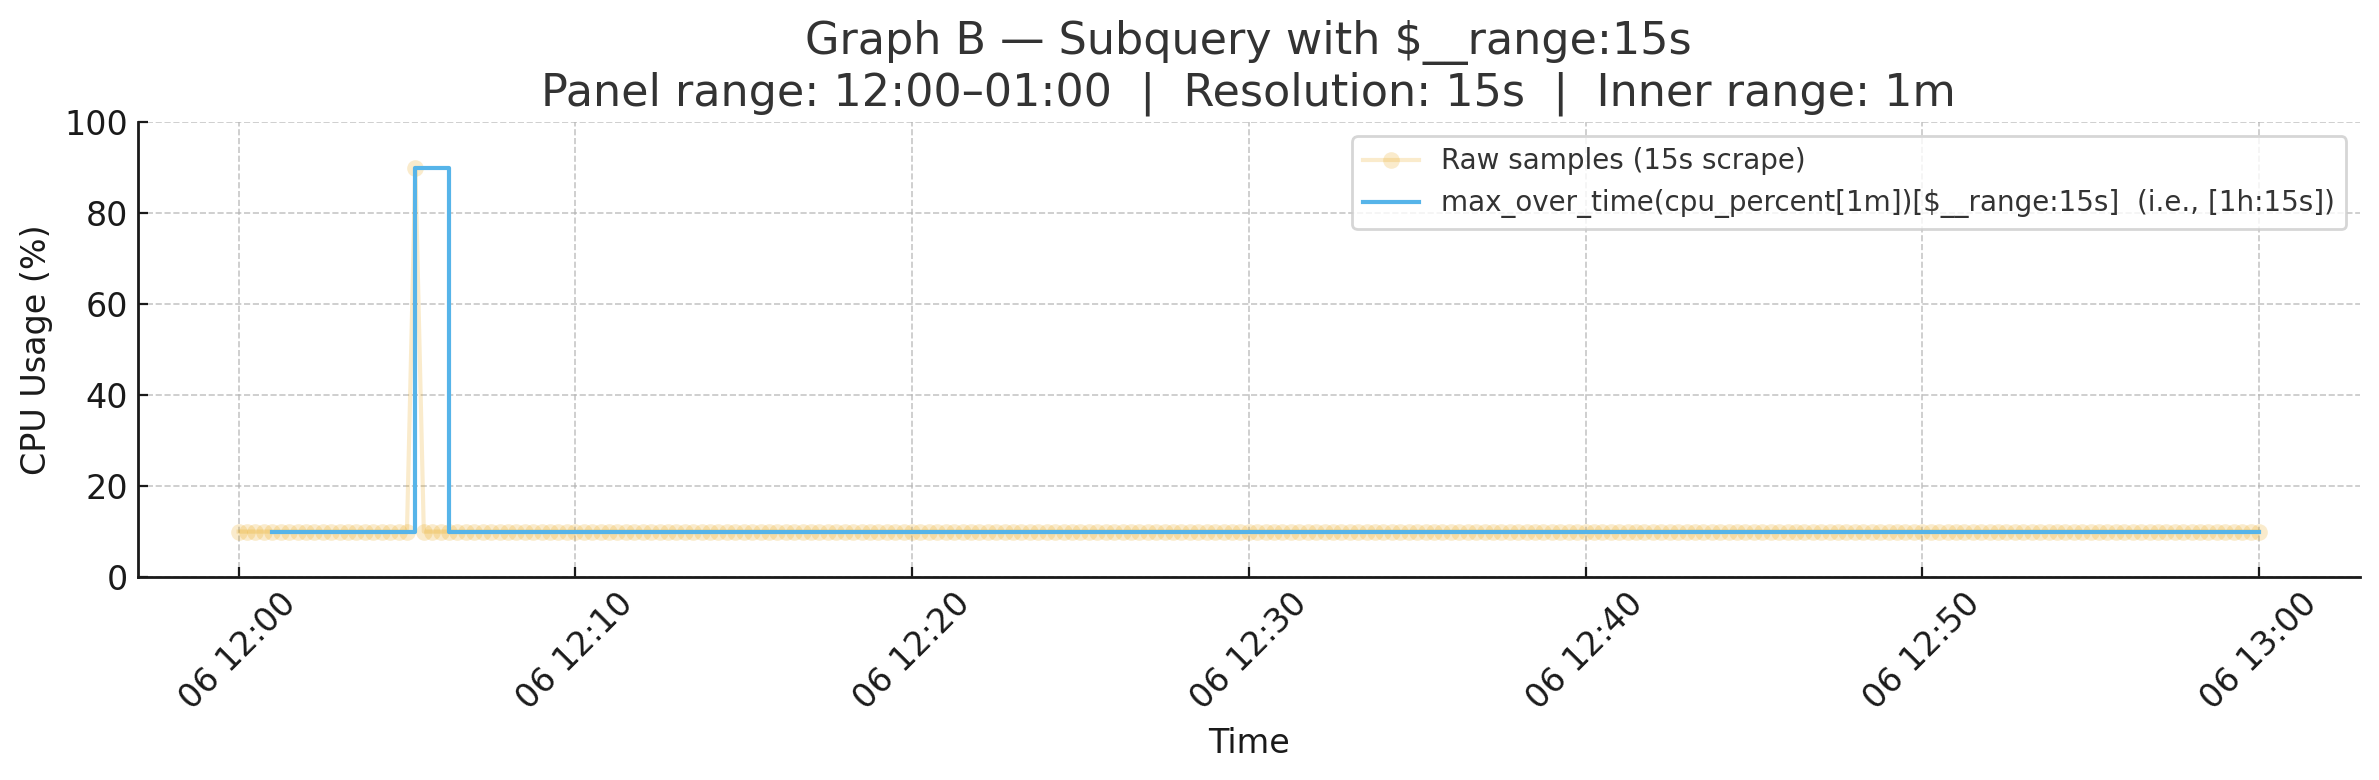
max_over_time(cpu_percent[1m])[$__range:15s]
- Inner
[1m]: look back 1 minute and take the max. - Outer
[$__range:15s]: recompute that inner max every 15 seconds across the full 1h panel. - Now evaluations happen at 12:05:00, 12:05:15, 12:05:30, …
That means the spike is captured exactly at 12:05:15.
Timeline:
Raw samples (15s):
12:05:00 ─ 10%
12:05:15 ─ 90%   <--- spike
12:05:30 ─ 10%

Eval points (15s):
12:05:00 ─ 10%
12:05:15 ─ 90%   <--- spike captured at exact moment
12:05:30 ─ 10%
Graph B — Subquery (max_over_time(cpu_percent[1m])[$__range:15s]):
Why it’s sharp
Now you’re checking every 15 seconds, which lands exactly on the spike.
How Subqueries Work
A subquery doesn’t change the inner function. It changes how often it’s evaluated.
- Inner expression: what each point means. Example:
max_over_time(cpu[1m]). - Outer
[range:step]: how densely to evaluate over the panel’s range. Example:[1h:15s].
Quick Grafana Tip
- Set Min interval = scrape interval in your panel settings (e.g. 15s).
- Then use
$__intervalor a subquery step close to your scrape interval. - Example:
max_over_time(cpu_percent[1m])[$__range:$__interval]
That way, your dashboards won’t miss short bursts.
Takeaway
If your dashboard feels too flat and you suspect short spikes are being hidden, add a subquery with a fine resolution step:
max_over_time(cpu_percent[1m])[$__range:15s]
That’s the difference between somewhere in that minute we spiked and we spiked at 12:05:15.