The Problem
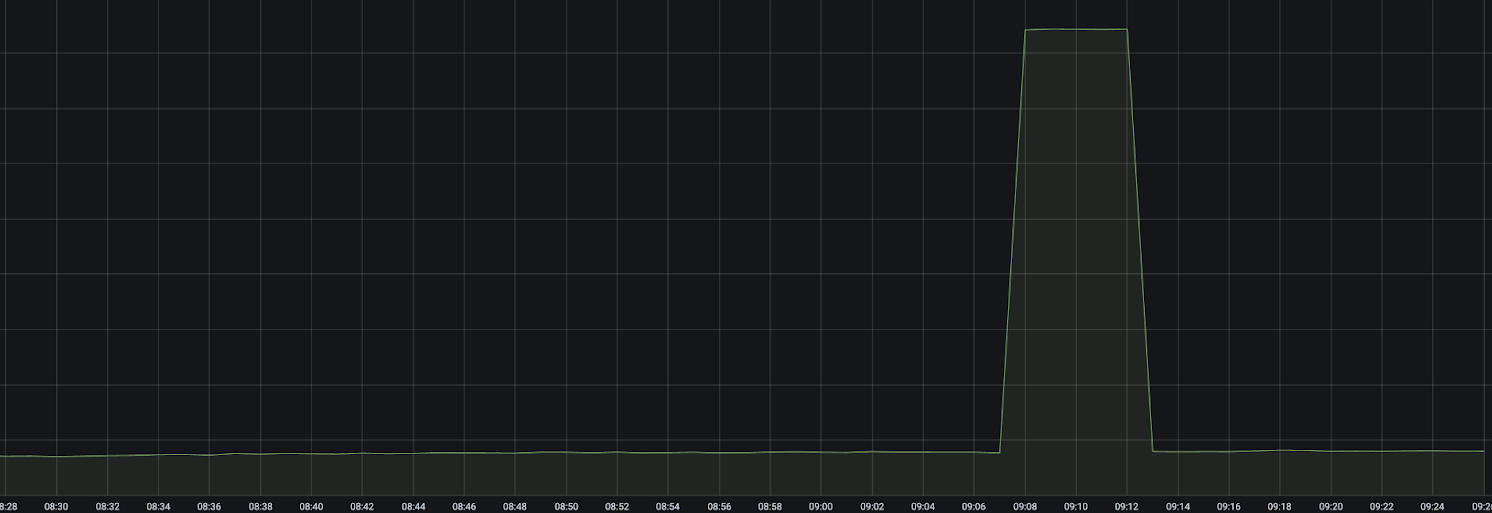
We have observed several Prometheus counters showing false spikes (i.e., no matching increase in logs) that could correlate with nodes experiencing kernel panics and reboots.
Why Do Counters Spike?
In Prometheus, counters are expected to be monotonic: they can never decrease. The only time a counter timeseries can decrease is if it is reset to zero (e.g., when a container restarts).
The PromQL functions increase() and rate() have special logic to handle counter resets like this. If a counter has a value of 100 and the next data point is 99, it is assumed that the timeseries was first reset to 0 and then incremented 99 more times. This would cause a jump of 99 in most graphs.

Background
- Our Python app is running on a Gunicorn server with multiple workers. This means multiple Python processes are serving requests because Python’s threading is restricted by the Global Interpreter Lock (GIL). Using multiprocessing is a good workaround.
- The app is running on a pod on a Kubernetes node.
- This app is instrumented with the Prometheus Python client in multiprocessing mode because each worker process runs independently and maintains separate metrics. Multiprocessing mode aggregates these metrics across all workers, ensuring that Prometheus scrapes produce accurate, unified data across the entire application, reflecting all requests handled by all workers.
- In multiprocessing mode, each process writes its metrics to a separate set of mmapped files. On scrape, the exporter web server reads all of these files and merges them (i.e., counters from process A and B are summed). In our Kubernetes setup, these files are stored in
/tmp, which is mounted as a KubernetesemptyDirvolume in most of our workloads.
How Are Reboots Causing Spikes?
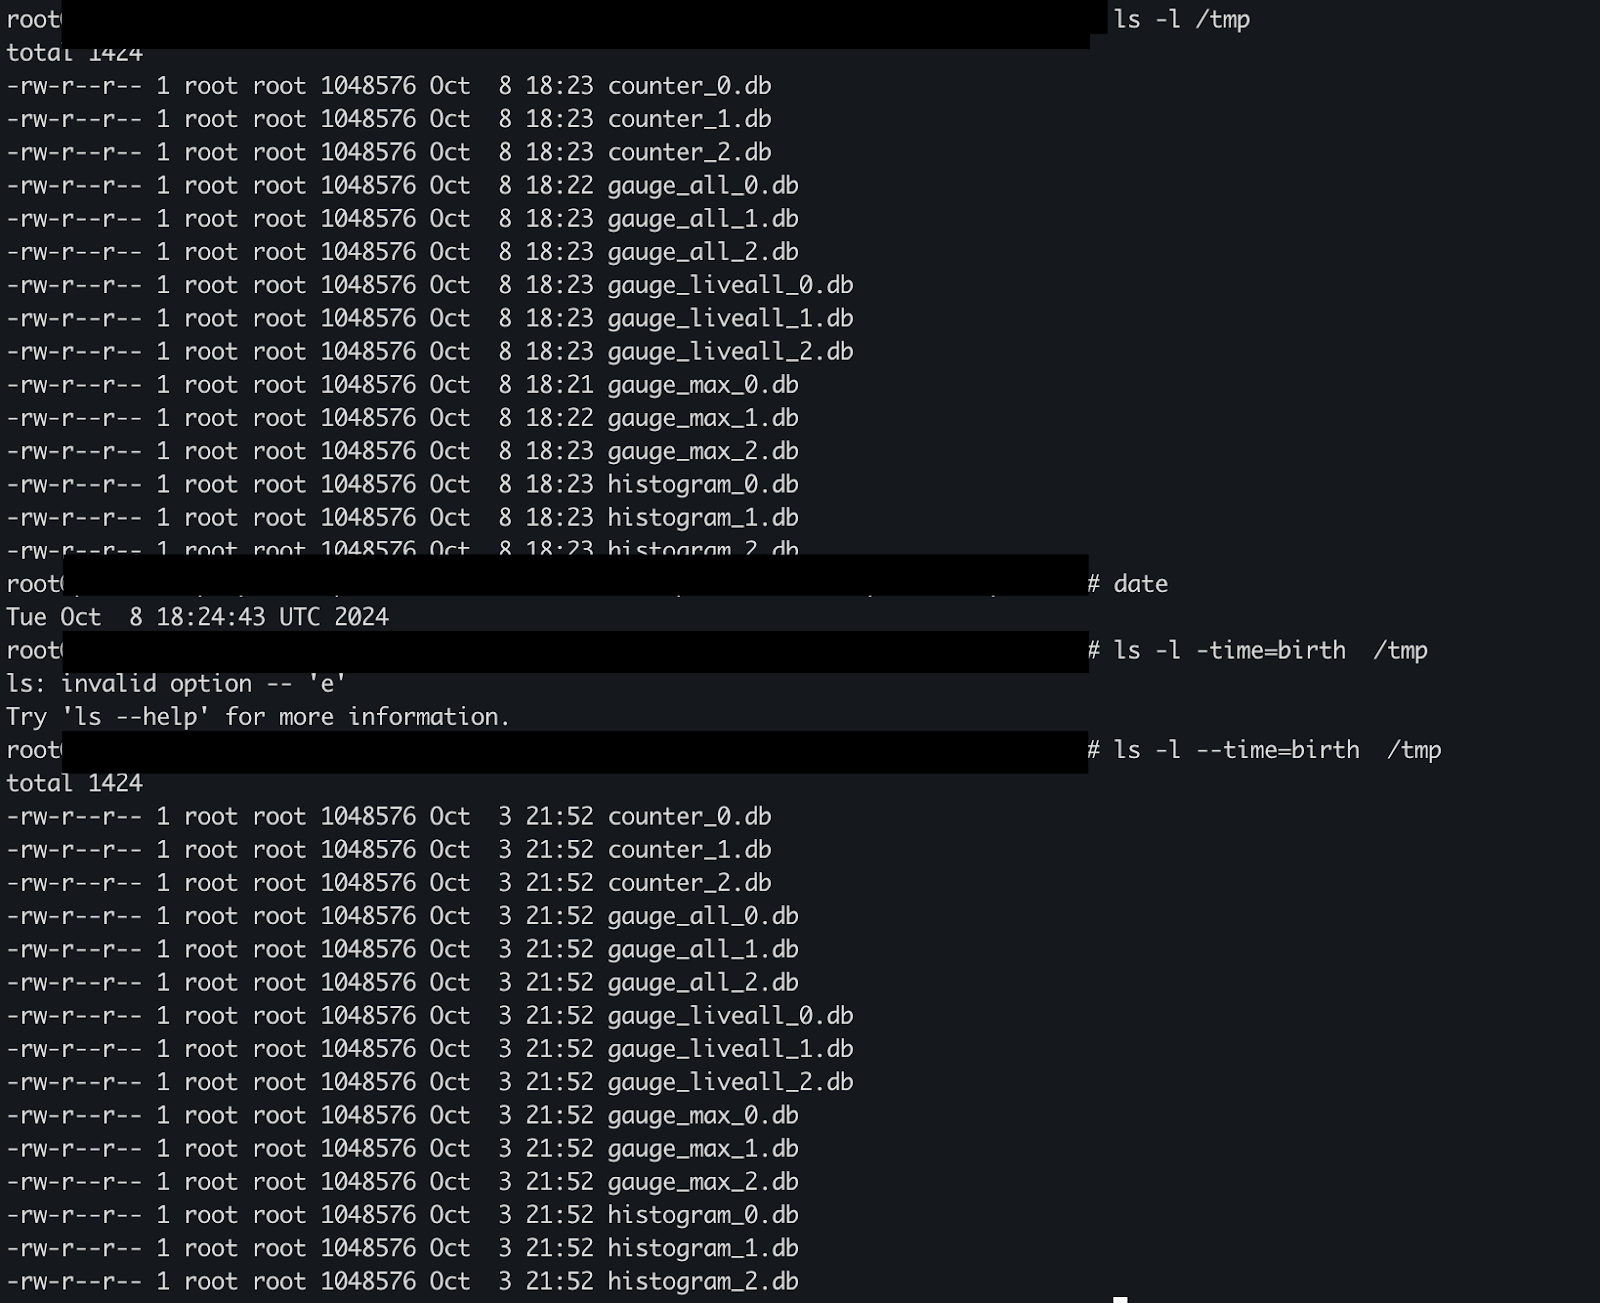
It turns out the emptyDir mounted to /tmp persists across container crashes.
We were able to exec into a pod that experienced a node reboot and confirmed that the filesystem timestamps in the metric files predated the node reboot by several days.

This means that after a reboot, pods are coming back with their old counter values. This would normally be fine as long as the node is not down for too long—the counter would just resume at the previous value and see no reset, as long as it hasn’t fallen out of the backend aggregator’s buffer (which has a 10-minute window in our setup).
In the backend, we drilled into the raw data points for the counter during one of the spikes and noticed it was incrementing and then decrementing by exactly one:
| TIMESTAMP | VALUE |
|---|---|
| 2024-09-23T05:05:05.37-04:00 | 72929 |
| 2024-09-23T05:05:35.37-04:00 | 72929 |
| 2024-09-23T05:06:05.37-04:00 | 72930 |
| 2024-09-23T05:06:35.371-04:00 | 72930 |
| 2024-09-23T05:07:05.371-04:00 | 72932 |
| 2024-09-23T05:07:35.37-04:00 | 72932 |
| 2024-09-23T05:08:05.37-04:00 | 72933 |
| 2024-09-23T05:10:59.487-04:00 | 72932 (decrease in counter) |
| 2024-09-23T05:11:29.496-04:00 | 72932 |
| 2024-09-23T05:11:59.5-04:00 | 72932 |
| 2024-09-23T05:12:29.489-04:00 | 72932 |
Sequence of Events
- The application process increments a counter from n to n+1 and writes the value to the mmapped file. This writes to the Linux kernel’s page cache (and is not immediately flushed to disk).
- A scrape occurs. The multiprocess exporter opens and reads all files. The kernel sees some of the files are already in the page cache and skips reading them from disk. The scrape exports the counter as n+1.
- A kernel panic happens before the page cache is flushed to disk. The counter increment is lost.
- The node encounters a kernel panic and reboots. Since the shutdown was not graceful, pods remain assigned to the node, so after startup containers are restarted with the same pod names, etc. Since the pod name is the same, the
emptyDirvolume is reused, and the pod keeps the last counter value that was flushed to disk (n). - A scrape occurs, and we export the counter with a value of n. Prometheus queries run
increase([..., n+1, n]), which is interpreted as an increase of n, causing a spike.
However, we have not attempted to reproduce this behavior to confirm this theory. Since this depends on the timing of the kernel writing the dirty page to disk and the kernel panic, it also makes sense that we would not see this behavior consistently with node restarts.
How Can We Fix It?
While a fix for the node reboot issue has been identified, we can be more robust here. The simplest solution is to clear out the metric files in /tmp on startup. Prometheus is designed for this—counter resets are normal.
- We could set the Prometheus multiproc directory to a memory-backed
emptyDirvolume (emptyDir.medium: Memory). This would naturally be cleared on node restart. This would make writes count against container memory instead. - We could add an init container that runs
rm $PROMETHEUS_MULTIPROC_DIR/*.dbon startup. This might impact pod start time slightly but is the simplest solution. - We could make the application delete
$PROMETHEUS_MULTIPROC_DIR/*.dbon startup.
Conclusion
So here we have it. An off-by-one (decrement to the count) can lead to an increment of 99. Who would have thought.